
Dear Investor,
The first quarter of this financial year has seen a strong pullback from the lows of March. So much so that many indices are close to their highs. Geopolitical crises and tariff war uncertainty have been absorbed, at least for the meantime. The next set of earnings will inform how the market behaves from here.
Reflecting on the sharp dip in the fourth quarter of FY25 can provide valuable insights for fund managers and investors alike. At our end, we constantly take feedback from the market and finetune our investing process accordingly. In the previous letter we had talked about how some changes in the portfolio based on valuation, and the context of the underlying sectors could have helped reduce drawdown in Agile Strategy. We have already incorporated these changes in our process. Similarly, in the case of Quant we have further refined our view on cash percentage in portfolio and timing of entries and exits. As students of the market, we are constantly on the lookout for reducing our errors in each cycle to maximize risk adjusted returns for our investors.
Concurrently, there were definitely some lessons for investors too in how the market behaved in the last few quarters. At the time of correction, there were calls by many seasoned fund managers to reduce/stop SIPs and shift to debt instruments. Any such action would have been totally counterproductive. In fact, additions to the portfolio at the time of deep correction were handsomely rewarded – as has been the case in previous such falls too. Buying “when there is blood in the streets” has proven to be a useful adage yet again. In the case of an investor with a sufficiently long time horizon and investing in a growing economy like ours, staying put and continuing investment via SIPs or otherwise is a simple and smart move.
This brings us to another set of discussions that we have with many investors – the question about how to use XIRR to understand the performance of the investment. For the uninitiated, XIRR or Extended Internal Rate of Return, tells you the annualized return of the portfolio adjusted for the timing of the cash inflows and outflows. It is specific to the respective investor based on the timing of their investment initiation, SIPs, additions and redemptions.
Compare this with TWRR or Time Weighted Rate of Return, which measures pure investment performance, removing the impact of cash inflows and outflows.
Scenario: Two investors invest the same total capital (₹3,00,000) in a fund over 3 years. The fund’s performance each year is as follows:
|
Year |
NAV Start |
NAV End |
Return |
|
Year 1 |
₹100 |
₹110 |
+10% |
|
Year 2 |
₹110 |
₹121 |
+10% |
|
Year 3 |
₹121 |
₹109 |
-10% |
Investor A (Lump Sum Early)
Invests ₹3,00,000 at the beginning of Year 1
Remains fully invested for all 3 years
Final value after 3 years = ₹3,26,700
XIRR ≈ 8.9% (matches TWRR)
Investor B (Phased Investment)
Invests ₹1,00,000 at the beginning of each year (Year 1, 2, 3)
Final value after 3 years = ₹3,07,800
XIRR ≈ 5.3%
TWRR Calculation (Fund Return)
TWRR = (1 + 10%) × (1 + 10%) × (1 – 10%) – 1 = 1.1 × 1.1 × 0.9 – 1 = 8.9%
TWRR reflects the fund manager’s true performance, independent of investor timing.
Summary Table
|
Investor |
Invested Pattern |
Total Invested |
Final Value |
XIRR / TWRR |
|
Investor A |
₹3L in Year 1 |
₹3,00,000 |
₹3,26,700 |
XIRR: 8.9%, TWRR: 8.9% |
|
Investor B |
₹1L/year for 3 years |
₹3,00,000 |
₹3,07,800 |
XIRR: 5.3%, TWRR: 8.9% |
A lot of investors like to look at XIRR to evaluate the performance of their capital and this certainly has value. However, the variables impacting XIRR need to be understood clearly. Without going into the math’s and putting it simply, there are two levers impacting XIRR:
-
Performance of the fund / underlying investment strategy (as measured by TWRR explained above) Investing in a fund with higher returns during a period will result in superior XIRR for the investor.
-
Timing of the capital additions or withdrawals Given the choice of a fund or investment strategy, capital additions during market corrections will boost the XIRR for the investor and vice versa.
As you can see from the illustration as well as the explanation above, the first lever here is in the control of the fund manager. The control of the second lever is shared. Fund managers can, from time to time, advise clients to advance or defer their capital additions; but eventually it is the decision of the individual investors. As you can imagine, a lot of behavioral biases creep into this decision – if an investor wants to add capital when the market is on the higher side and is scared of doing so during corrections; it is the exact opposite of what is desirable to boost the XIRR! Of course, often, the timing of capital inflow or outflow is simply based on the availability/need of capital.
In summary, when looking at the XIRR number, an investor should judge both the fund performance and the timing of the capital inflow/outflow.
The more important question is – how to decide when to initiate investments or to add capital?
-
Adding at bottom improves XIRR: The ideal course of action is of course infusing fresh money into equity when the market is struggling, because the lower expectations about the future help in buying at lower valuations.
-
SIPs: The behavioral aspect is equally important for every investor depending on individual temperament and ability to rise above fear of uncertainty about the future at that time. Hence, a more practical approach for any investor may be to spread fresh investments over the course of time so that the average buy prices are lower than just buying when the market is doing very well.
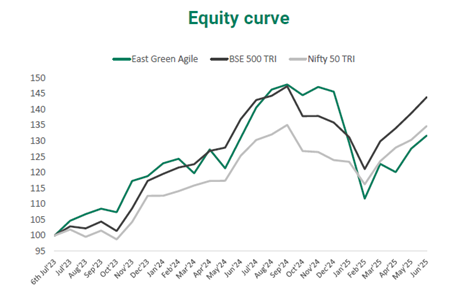
Agile Strategy Performance
East Green’s Agile strategy has delivered a return of 14.9% (annualized, post fee and expenses) since its inception in July 2023.
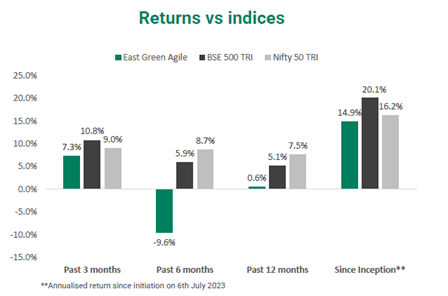
Note: East Green return numbers mentioned here are time weighted and are calculated net of all fees and expenses. These have not been verified by SEBI. Additionally, performance of individual client portfolios may differ during the period.
Agile Portfolio Overview
At the end of this quarter, the sectors with highest allocation were pharma & healthcare, industrials and consumer tech. These were also the highest allocation sectors at the end of the previous quarter, implying that we have held on to performers in these sectors. Significant additions in this quarter were made in the lending space with improving outlook for this sector.
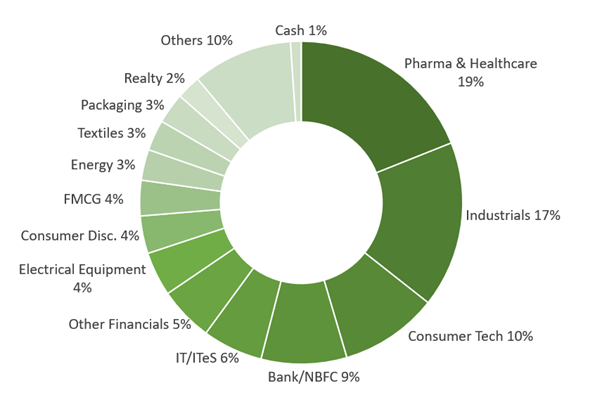
Note: Individual portfolios may differ depending on time of investment and subsequent capital addition/withdrawals
Key changes to the portfolio this quarter:
- Initiated position in a contrast media manufacturer with major upside expected in the immediate future from their CDMO vertical. A temporary dip in the price due to tariff related news allowed us the opportunity to enter at an attractive buy price.
- Initiated positions in a housing finance company and a small finance bank and increased our positions in the microfinance space. A lot of the pain in small lending appears to be behind us and we have increased our exposure to these segments to benefit from the expected credit upcycle.
- Initiated position in a yarn manufacturer with major capacity of polyester yarn coming up this financial year. The stock was available at an attractive valuation which provided a good margin of safety. Any FTAs that are signed by India would provide further tailwinds.
- Re-entered a hotel stock with attractive upside potential due to deleveraging. The company had earlier fallen behind its deleveraging guidance prompting our exit. However, they have entered an agreement with a marquee investor group recently to aid their capex and deleveraging plans bringing them back on track.
- Initiated position in a graphite electrode company. The prices of graphite electrodes are at their cyclical lower quartile and can show an upside from here. Additionally, the company has planned a corporate restructuring which can further help unlock shareholder value.
- We exited positions in two diagnostics companies. One of these, which works on a PPP model, was facing major difficulties in collections from state governments leading to major working capital issues. The other company was executing as per schedule but had a slightly higher valuation resulting in downward pressure on the stock.
- Exited a company in the wind energy space which had started falling behind its earlier guidance.
- As before, we tactically trimmed our positions in stocks for risk management, as needed.
Quant Strategy Performance
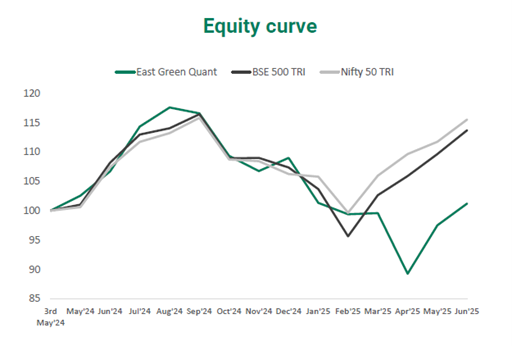
Our Quant strategy, which was initiated in May 2024, has delivered a return of 1.1% (annualized, post fee and expenses) since inception.
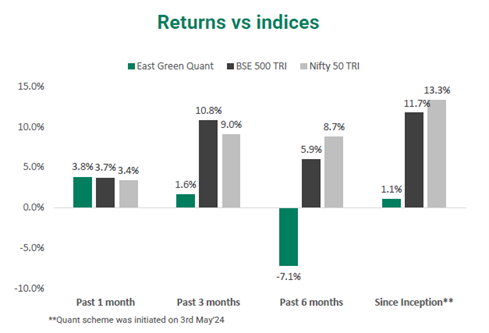
Note: East Green return numbers mentioned here are time weighted and are calculated net of all fees and expenses. These have not been verified by SEBI. Additionally, performance of individual client portfolios may differ during the period.
Quant Portfolio Overview
Q1 FY2026 presented a significant test for our quantitative strategies, beginning with extreme volatility in April. The re-emergence of tariff concerns triggered a sharp market downturn, prompting our models to swiftly initiate a risk-off posture and significantly reduce portfolio exposure to preserve capital. While this protective stance effectively shielded us during the sell-off, the market’s rapid recovery later in April meant that some immediate rebound potential was not fully captured, a calculated trade-off inherent in prioritizing capital preservation during periods of high uncertainty.
However, as volatility subsided through May, and stability returned, our algorithms systematically re-engaged and increased exposure. This methodical re-investment allowed us to capitalize on the sustained market rally, driving strong outperformance vs Nifty 50 (~780 bps) throughout May and June. This positive momentum has continued into July, with early data indicating our strategies remain well-aligned with prevailing market trends.
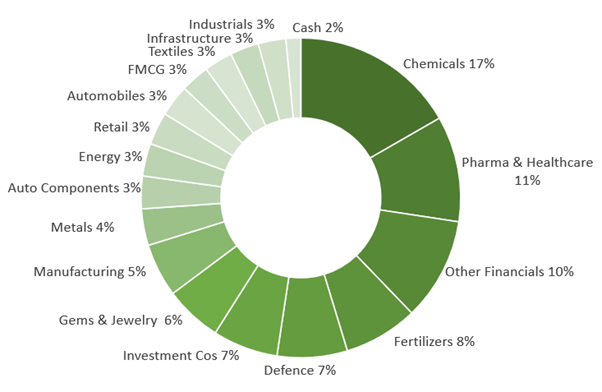
Sectoral allocation:
Market Outlook and Way Ahead
At the time of writing this letter, the next set of earnings had begun to be filed. The IT sector has not been able to deliver growth and the forecast for the immediate future for this sector is still not very bright. Banking and consumption stocks updates are a mixed bag.
The sharp correction witnessed in the latter half of the last financial year has had a silver lining: valuations in several sectors have reverted to more reasonable levels (although in many others they are still on the higher side). Given this and the next set of macro changes, sector and stock leadership can also be expected to change as has happened in the past such cycles.
A few positives loom on the horizon. The government and central bank are trying to push consumption and capex through a softer tax and interest rate regime. Monsoon is expected to be normal, and inflation remains in check. Renewal of IPOs also point towards improving sentiment. Tariff related confusion has to abate at some time.
We keep our eyes and ears open to business and market trends to adapt the portfolio to market changes and benefit from them.
Best Regards,
East Green Advisors LLP
Disclaimer/Disclosure:
This document is issued by East Green Advisors LLP [East Green PMS]. This document has been prepared and issued on the basis of internal data, publicly available information, and other sources believed to be reliable. The purpose of this letter is to provide general information about the market and the house view of East Green Advisors LLP. It is produced for information purposes only and should not be construed as investment advice to any party. It does not constitute a prospectus or offer document or an offer or solicitation to buy any securities or other investment. All opinions, figures, charts/graphs, estimates, and data included in this document are as of the date of issuance and are subject to change without notice. While utmost care has been exercised while preparing this document, East Green PMS does not guarantee the absolute accuracy of the information provided and disclaims all liabilities, losses, and damages arising out of the use of this information. The statements contained herein may include forward-looking statements that are based on our current views and assumptions and involve known and unknown risks and uncertainties that could cause actual results, performance, or events to differ materially from those expressed or implied in such statements. Readers shall be fully responsible and liable for any decision taken on the basis of this document. Investments in securities are subject to market and other risks. East Green PMS does not offer any guaranteed or assured returns. Please read the disclosure document carefully before investing. Past performance should not be taken as an indication or guarantee of future performance. Additionally, the performance data mentioned here has not been verified by SEBI.