
Dear Investor,
The market has corrected from the recent top in September 2024. At the time of writing this, the Nifty 50 is 12% below its all time high close three months back. A similar correction can be seen across indices and individual portfolios. It is, of course, naive to assume that markets always trend upwards. Corrections are inevitable and in fact important to keep valuations in sync with business realities. Even so, drawdowns hurt!
Risk management is integral to equity investing. But what exactly constitutes risk? In financial theory, volatility is used as a metric of risk. However, you will find many gurus of investing talking about embracing volatility (within limits) and worrying more about permanent capital loss. Let us look at both of these in more detail.
Volatility as Risk:
- Volatility is simply the fluctuation in the price of a stock or equity portfolio over time. This is measured via metrics such as standard deviation, beta, drawdown etc.
- Why is it considered risk:
- Large and frequent price swings create uncertainty, which can lead to emotional decisions like panic selling.
- However, volatility does not always equate to loss, as prices may recover with time.
Possibility of Capital Loss as Risk:
- Capital loss implies the permanent loss of investment value, due to a decline in the stock price(s).
- Why is it considered risk:
- Unlike volatility, capital loss represents the realized loss of principal.
- This particularly impacts investors who sell during downturns or invest in the wrong set of stocks.
Which one is more relevant? The answer depends on the context and the investor’s perspective.
For short term investors, volatility is more relevant as price swings can significantly impact returns over a short horizon. In other words, volatility can lead to permanent capital loss for a short term investor. Managing volatility is therefore crucial for those who need liquidity or have immediate financial goals.
For long term Investors, the possibility of capital loss is more relevant. This is because in the long term, markets tend to recover from volatility, but investing in poorly performing companies or overpriced stocks can result in irreversible losses. How the price moves month to month matters less to you if you can stay invested for longer and receive handsome returns at the end of the investment period.
Let us look at an example to illustrate this.
Take two investors:
A. Makes steady 15% returns annually
B. Makes volatile 25% returns annually
Financial theory, and many advisors would say that B is riskier. But the devil lies in the details.
At 30, with a 30-year horizon: Volatility can be embraced
At 60, living off investments: Volatility is terrifying
The math:
If INR 1L grows at 15% for 30 years, the corpus grows to INR 66L
If INR 1L grows at 25% for 30 years, the corpus grows to INR 807L
The difference? 741L

So if you still have many working years left and/or you have other assets (real estate, cash, gold), you may want to rethink the volatility-reward payoff equation. This is, of course, if your investment horizon is at least a few years.
You must also consider the “risk” of not achieving your financial goals by tilting too much towards very safe instruments such as bank FDs. A 7% extremely safe and zero volatility return will not leave you much when adjusted for inflation.
To be clear, the above discussion should not be taken to imply that a more volatile investment is necessarily superior or that fund managers should completely ignore volatility. If drawdowns can be reduced, they should be. But again, within reasonable limits, some volatility needs to be accepted, managed and even embraced. This is the summary of how we, at East Green, look at volatility.
This brings us back to the contemporary market correction. In our previous letter, we talked about the near term risks to the market including valuation, slowdown in earnings growth and global uncertainty amongst others. Many of these risks played out leading to the correction we saw this quarter. However, we were able to reduce the correction in East Green portfolios to below those of the indices (you can see the return comparisons in the following pages). What worked for us are the following:
- Low allocation to sectors and themes showing growth concerns
- Bias towards high growth and high quality businesses, which typically attract investor interest even during not so good times
- Diversification, across stocks and sectors
- Risk based allocation to individual stocks
- Adjusting portfolio beta dynamically
Going forward too, our risk management principles will continue to stay at the core of our investing process with the aim of delivering superior returns keeping risk in check.
Agile Strategy Performance
East Green’s Agile strategy has delivered a return of 28.6% (annualised, post fee and expenses) since its inception in July 2023. Over the same period, the return for S&P BSE 500 TRI was 22.8% and for Nifty 50 TRI it was 15.5%.


Note: East Green return numbers mentioned here are time weighted and are calculated net of all fees and expenses. These have not been verified by SEBI. Additionally, performance of individual client portfolios may differ during the period.
Agile Portfolio Overview
At the end of this quarter, the sectors with highest allocation were pharma-healthcare (good risk-reward), other financials (capital markets focused) and consumer tech (good growth prospects). Our allocation to lending (banks and NBFCs) was zero, considering the headwinds in this space.

Note: Individual portfolios may differ depending on time of investment and subsequent capital addition/withdrawals
Key changes to the portfolio this quarter:
- Exited two consumer staples stocks (confectionary, milk) given challenges to demand reflected in slowdown in growth in the sector.
- Exited stocks in insurance, hospitality and commercial real estate business to create space for new opportunities with higher growth prospects.
- Exited the lending space, given short term headwinds in both lending and deposit growth.
- Initiated a position in a hospital chain that has aggressive growth plans and room to grow its ARPOB (Average Revenue Per Occupied Bed).
- Added a diagnostic company to the portfolio. This company’s model involves PPP based diagnostic centres and has very strong growth guidance. This is in addition to an existing radiology focused diagnostic stock in the portfolio.
- Initiated position in two retail stocks. One of these is focused on electronics sales in North India; the other is a new listing which sells products across various segments. The same store sales growth for both of these has been very robust, implying strong management quality in both.
- Initiated position in a company having robust music IP and very high ROCE due to platform nature of the business.
- Initiated position in a packaging company stock, given signs of reversal of the cycle and very sweet valuation.
Quant Strategy Performance
Our Quant strategy, which was initiated in May 2024, has delivered a return of 9.0% (post fee and expenses) vs 7.4% for S&P BSE 500 TRI and 6.3% for Nifty 50 TRI in the same period. Since this is a new strategy and new investors have been adding capital, the actual returns in investor portfolios would be higher than in the reported numbers which has a drag because of higher initial capital additions.


Note: East Green return numbers mentioned here are time weighted and are calculated net of all fees and expenses. These have not been verified by SEBI. Additionally, performance of individual client portfolios may differ during the period.
Quant Portfolio Overview
This quarter saw slight outperformance in a bearish to flat market. The entire quarter was characterised by an unstable and confused market regime. Notably, small caps outperformed large caps, which is not usually the case in a falling market* . However, that meant it triggered our risk-off signals, and we did reduce equity allocation a few times in the last quarter.
Despite market instability, we observed significant sector movements in our portfolio, whenever the portfolio was invested in equities. We moved to pharma and manufacturing stocks, while staying put in existing capital goods stocks.
We have spoken about the quantitative method and how we construct the portfolio a few times in the past. Let’s focus on the outcomes this time.
There are 4 kinds of investor emotional outcomes for a fund, depending on where the markets are and where the return of the fund is in:

These are the general outcomes, irrespective of type of the market. The lower left corner is most painful for investors and has to be avoided at all costs. And everyone tries to move to the top right corner, i.e., have great returns and also outperform the benchmark/peers.
Let’s break these by the state of the market:
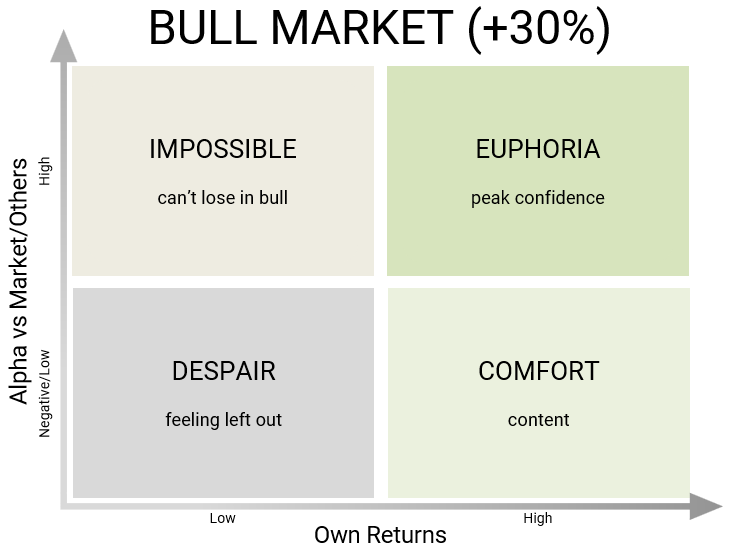
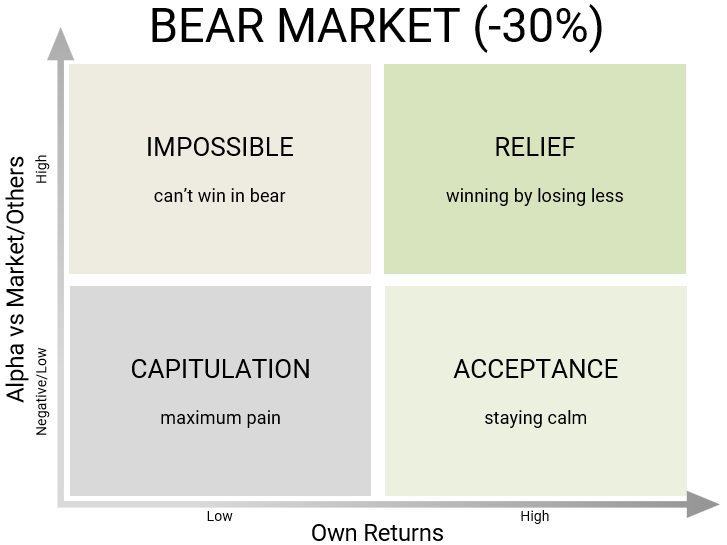
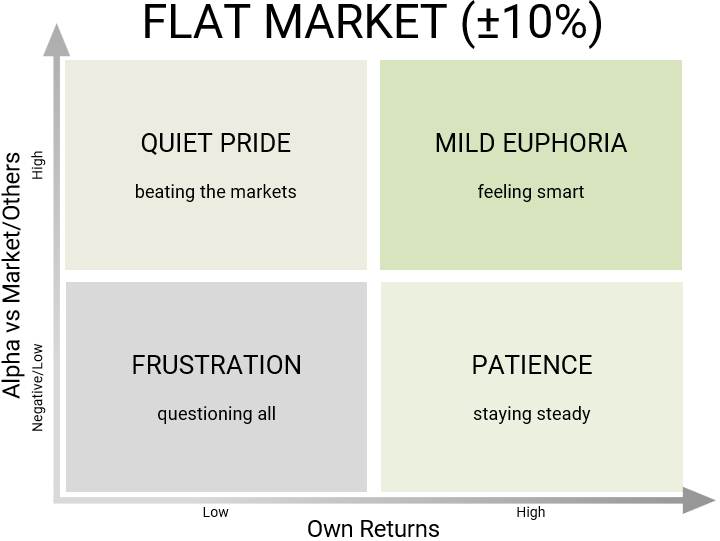
We see that the highest magnitude of returns are obviously in a bull market, and not surprisingly, the lowest in a bear market. Long term CAGR is built on doing well in both these states and avoiding the bottom left zone at all cost. But, if we look at a market where there is no great move on either side, it matters less which quadrant you lie in. The differences in emotional states are also less extreme in this kind of a market.
And that’s how the quantitative strategy has been built. We do not mind underperforming in periods where there isn’t much of a move on either side, which is exactly the kind of market it was in Q3. We did outperform the benchmarks, but the numbers weren’t too great.
Moreover, market returns are never normally distributed but have a fat left tail and thin right tail, in addition to having a negative skew, statistically speaking.

What this means – you don’t get many months with 10%+ gains but you do get months with 20-30% falls, i.e., that large negative returns happen more often than large positive returns. So, the key here is to avoid the large falls. In the course of doing so, we might have multiple small losses but it ends up not mattering much in the longer run, because of small percentage points of opportunity losses.
To summarize, we intend to do very well when markets are good and intend to not play aggressively and fold our cards when markets aren’t too good, in order to avoid the large losses. In the course of that action, there might be certain months of small and acceptable underperformance.
Market Outlook and Way Ahead
The Indian market, unlike its developed market peers, is still in correction mode. This is explained by flight of capital outside India due to high yields in the US and some opportunity sensing in China. Also, earnings in many sectors have failed to enthuse investor confidence, although there are many pockets of growth as well. As of now the indices seem to be rangebound and will require a catalyst (maybe something positive in the budget) to rebound from these levels.
Our strategies in Agile and Quant remain unchanged. In Agile, we will continue to stay invested in high growth, high quality businesses available at reasonable valuations. As and when the market rebounds, these kinds of stocks are the most likely to be rewarded. In Quant, the buy/sell decisions are firmly established in backtested rules and hence market improvement will dictate further portfolio decisions.
In both of these, risk management sits at the core of the investment process and remains strong in every type of market environment.
Best Regards,
East Green Advisors LLP
Disclaimer/Disclosure:
This document is issued by East Green Advisors LLP [East Green PMS]. This document has been prepared and issued on the basis of internal data, publicly available information, and other sources believed to be reliable. The purpose of this letter is to provide general information about the market and the house view of East Green Advisors LLP. It is produced for information purposes only and should not be construed as investment advice to any party. It does not constitute a prospectus or offer document or an offer or solicitation to buy any securities or other investment. All opinions, figures, charts/graphs, estimates, and data included in this document are as of the date of issuance and are subject to change without notice. While utmost care has been exercised while preparing this document, East Green PMS does not guarantee the absolute accuracy of the information provided and disclaims all liabilities, losses, and damages arising out of the use of this information. The statements contained herein may include forward-looking statements that are based on our current views and assumptions and involve known and unknown risks and uncertainties that could cause actual results, performance, or events to differ materially from those expressed or implied in such statements. Readers shall be fully responsible and liable for any decision taken on the basis of this document. Investments in securities are subject to market and other risks. East Green PMS does not offer any guaranteed or assured returns. Please read the disclosure document carefully before investing. Past performance should not be taken as an indication or guarantee of future performance. Additionally, the performance data mentioned here has not been verified by SEBI.