
Diversification has long been hailed as a cornerstone strategy for managing investment risk and optimising returns. In this article, we will explore the performance of global markets over the past 30 years, starting just after liberalisation of the Indian economy. We aim to answer the crucial question: Is geographical diversification a prudent strategy, or does a home bias towards the Indian market offer superior returns?
Let’s take two scenarios:
- You invested 1 million in BSE Sensex in Jan 1994
- You invested 1 million equally in Sensex, S&P 500, FTSE 100, and Nikkei 225 in Jan 1994
By Dec 2023 (after 30 years) the value in scenario #1 was ₹2,16,17,842 (CAGR of 10.8 %) and in scenario #2 was ₹1,44,57,685 (CAGR of 9.3%). We have adjusted the value for currency depreciation.
Returns:
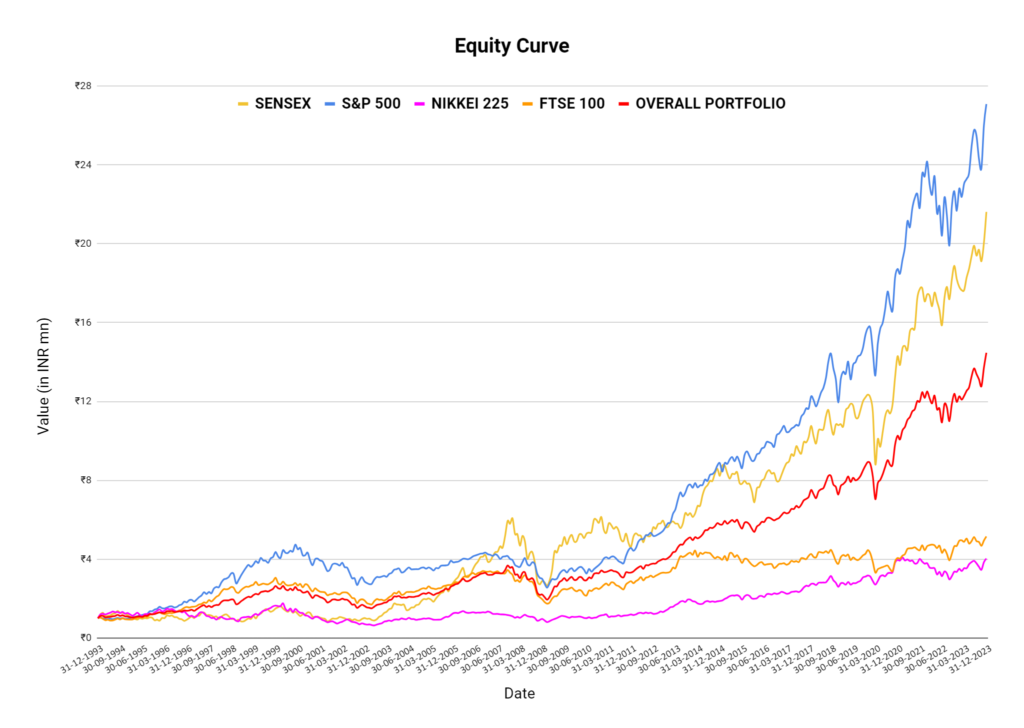
| SENSEX | S&P 500 | FTSE 100 | NIKKEI 225 | PORTFOLIO | |
| CAGR | 10.8% | 11.6% | 5.6% | 4.7% | 9.3% |
Among the 5 indices, S&P 500 and Sensex have delivered the highest annualised return. Although India has a higher beta because of being an emerging growth market, S&P 500 has beaten Sensex returns because of INR depreciation.
Drawdown Analysis:
Drawdowns are one way to portray the risk of a portfolio. Lower drawdowns indicate lower risk of the portfolio.
While BSE Sensex and S&P 500 have provided higher returns, it’s essential to consider the associated risks and drawdowns. Drawdown measures the maximum decline from the highest peak in an investment.
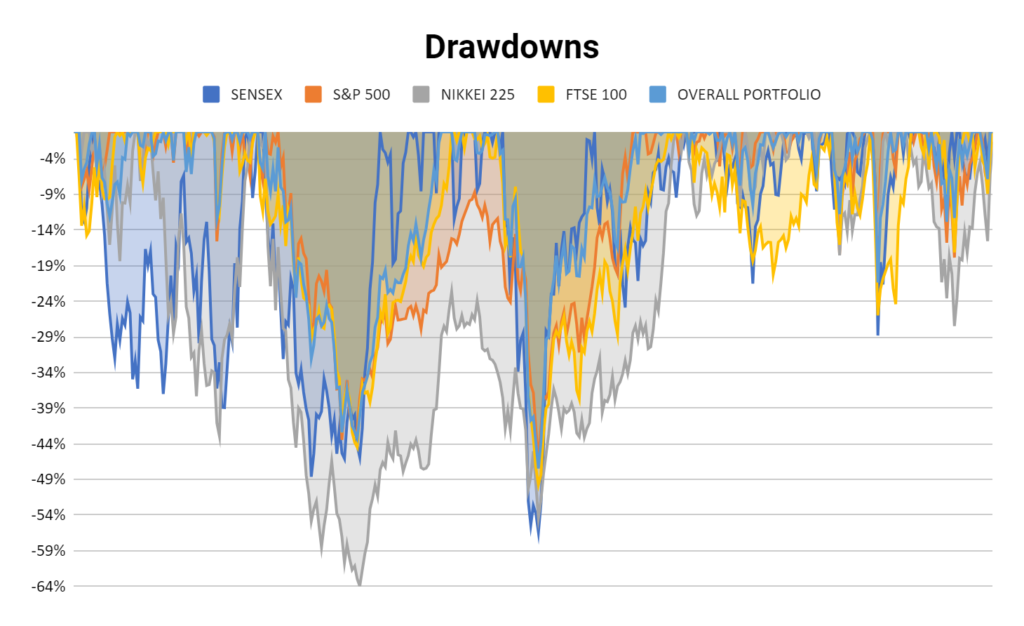
- BSE Sensex: Maximum drawdown of 56.2%
- S&P 500: Maximum drawdown of 46.0%
- FTSE 100: Maximum drawdown of 49.5%
- Nikkei 225: Maximum drawdown of 63.8%
- Equally diversified portfolio: Maximum drawdown is 47.2%
The drawdown of the overall portfolio is only slightly less compared to other indices. The drawdowns of individual indices are also not too different, in spite of the other 4 indices being developed markets. This goes to show the globalised nature of business now and economies are more interconnected than ever before.
Moreover, the drawdown of Nikkei is elongated, showcasing it took more time for them to be over water whereas other indices, especially, Sensex has reached the previous high significantly faster.
Correlation Insights:
It is important for assets to be uncorrelated among themselves in order to reap the benefits of diversification within a portfolio. If two assets in your portfolio are correlated, then you aren’t really diversifying. A lower correlation coefficient (around 0) implies that assets do not move in tandem. Comparing the correlation coefficients between BSE Sensex and other global indices, we can check whether there are diversification benefits or not.

Sensex used to be uncorrelated with global indices in the first period under consideration. But since then, all the 3 indices have become correlated with Sensex and the relationship has become tighter over time. This is because the impact of globalisation has gone up over the decades. The kink for FTSE is due to Brexit but now it has gone back to being closely correlated with Sensex.
None of the global indices are negatively correlated which would have meant inverse correlation and would have indicated really good diversification in the portfolio.
Volatility Metrics:
| Standard Deviation | Sharpe Ratio | |
| Portfolio | 16.5% | 0.38 |
| Sensex | 29.6% | 0.26 |
| S&P500 | 18.7% | 0.46 |
| FTSE100 | 17.4% | 0.15 |
| Nikkei | 20.5% | 0.09 |
This lower standard deviation for the diversified portfolio implies a lower degree of volatility and, consequently, lower risk.
The Sharpe ratio shows the risk-adjusted performance of each index and the overall portfolio. The Sharpe Ratio measures the average return earned in excess of the risk-free rate per unit of volatility or total risk. It is calculated as the excess return (portfolio return minus the risk-free rate) divided by the standard deviation. For simplicity, we have considered a risk-free rate of 3%.
A higher Sharpe Ratio indicates better returns per unit of risk taken. Here also, the diversified global portfolio is performing well, with S&P 500 (INR adjusted) having the best Sharpe ratio.
Conclusion:
If you want to get unit highest returns for the possibility of temporary maximum loss, it makes sense to invest only in Sensex and S&P 500. Moreover, the temporary maximum loss (drawdown) typically happens due to a massive global event which hurts all markets.
If you want a smoother equity curve and want to reduce portfolio volatility throughout your life, while not having the best of returns, you should diversify globally. But, beware – your actual drawdowns would not be reduced during big global events.
But then, past performance does not guarantee future results, and no one knows anything beyond a point. For instance, INR depreciation has helped S&P 500 returns in INR terms in the past. It may or may not have the same rate of depreciation in the future.
However, global diversification remains a good way to hedge against ignorance or geographical/political risks. As with any investment decision, thorough research and a clear understanding of individual risk preferences are paramount.